
MAPPING ON E-FLORA BC
Read about limitations of our maps here.
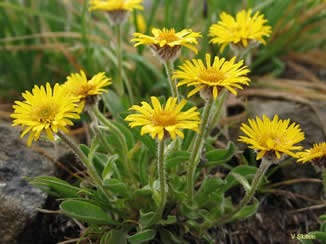
Golden Fleabane (Erigeron aureus), photo by Virginia Skilton
INTRODUCTION
Mapping is a significant component of E-Flora BC and helps us visualize species distributions. On E-Flora BC, we use dynamic interactive mapping that allows users to explore species distributions using a comprehensive centralized data set.
Dynamic Interactive Mapping
Dynamic interactive mapping is significant in two ways.
1) A dynamic map is one that is generated at the moment of a search and this means that the maps are based upon the most up-to-date versions of available databases--that is, they are current. We update our mapping database regularly.
2) Interactive GIS maps are more than 'just maps'--they are analytical tools that allow users control over the information they wish to view. That is, instead of simply displaying distribution, the interactive maps provide you with with a default view, but also allow you to select the layers you wish to view. You can turn layersw off and on for your personal selection.
Key Points About Our Interactive Mapping
The data layers we provide include all available databases of plant distribution in BC. This includes both collections-based and observation-based databases (e.g. the BISON observations derived from iNaturalist). If visible, these databases are listed in the legend on the right hand side of the map. Details on the databases are provided below. Note that the distribution shown on our maps is only as accurate and up-to-date as the databases we use. Each institution works to update their database and their collections identifications on an ongoing basis. New taxonomic work may or may not be reflected in a database immediately.
Changing the Default Layers
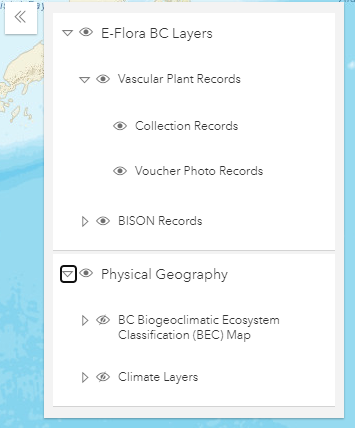
Click on the Layers icon on the left side of the screen ![]() in order to access the individual layers (i.e., be able to turn a layer on or off). Once opened, you can click on the triangle icon ( ▷ ) to reveal the sublayers that are available to be turned on or off.
in order to access the individual layers (i.e., be able to turn a layer on or off). Once opened, you can click on the triangle icon ( ▷ ) to reveal the sublayers that are available to be turned on or off.
Small and Big Maps
On E-Flora, we provide two versions of our maps:
Geographic Area Covered By Our Maps
Our maps focus primarily on species distribution in BC and the Pacific Northwest and now also provides records across Canada and the United States. Pan the interactive maps to view distribution dots in other regions. Although our maps open up on BC, you can pan to anywhere on earth.
Listed Species on the Maps
Locations of listed species in British Columbia (that is, rare, threatened or endangered species) are mapped to general coordinates only.
Where to report map errors
Our maps are based on data provided by various sources. Map errors should be reported to the data provider. Contact information for our data providers is provided below, or go here.
Information presented on our distribution maps is drawn from these databases :
Metadata for the databases
The UBC Herbarium provides the CPNWH, on an ongoing basis, with its records for vascular and nonvascular plants that have been entered into their databases. This represents 179,928 vascular plant records, 167,849 bryophyte records, 73,866 algae records,32,738 fungi records, and 41,996 lichen records. The complete UBC Herbarium plant databases, with nearly 450,000 records, are available on-line. Please send comments and corrections directly to the UBC herbarium ubc.herbarium@ubc.ca.
BCCDC (British Columbia Conservation Database)
Records from the BCCDC are from the Non-sensitive Occurrences database. These records are individual, verified occurrences for species mapped by the BC Conservation Data Centre. Information on the content of this database can be found here. Please send comments and corrections related to either database to Jenifer Penny.
V (RBCM) (Royal British Columbia Museum Herbarium Database)
The RBCM (V) vascular and nonvascular plant records used in E-Flora have been downloaded from CPNWH. The total number of records provided to us is 218,884. Please send comments and corrections directly to Dr. Ken Marr.
ALA (University of Alaska Herbarium Database)
Vascular and nonvascular plant records for southern Alaska were downloaded from CPNWH; a total of 200,307 records. Information on the Herbarium can be found here.
PNW (Consortium of Pacific Northwest Herbaria Database)
Vascular and nonvascular plant records were obtained from the Consortium of Pacific Northwest Herbaria database (~3 million records across all species groups). Note that BC-specific records from UBC, ALA and the RBCM (V) have been treated separately (i.e., the CPNWH records plotted in E-Flora BC do not include records from UBC, ALA or V). The Consortium records include records from Oregon State University Herbarium, University of Idaho Stillinger Herbarium, University of Washington Herbarium and many additional sources. (Accessed through PNW Herbaria Portal, www.pnwherbaria.org,). Questions and corrections for data from the Consortium should be directed to the individual institutions/data providers listed here.
Other
British Columbia plant species codes and selected attributes. Version 6 Database.
These species code files contain the presently accepted scientific and common names for vascular plants, mosses and lichens of British Columbia. The liverworts and hornworts included on this list are derived from the North American lists, as a B.C. list does not exist. Species attributes include lifeform, toxicity, weed status, wetland indicator value, rare (red or blue list) ranking, and whether native or exotic. As the Illustrated Flora of British Columbia is now complete (a total of 8 volumes), this list will only be updated when required (every 1- 2 years). Additional details, and the complete species list, can be found on the BEC web site. The citation for this data is: Meidinger, Del; Lee, Tina; Douglas, George W.; Britton, Greg; MacKenzie, Will.; Qian, Hong. 2009. British Columbia plant species codes and selected attributes. Version 6 Database. Research Branch. B.C. Ministry of Forests.
Recommended citation: Author, date, page title. In: Klinkenberg, Brian. (Editor) 2021. E-Flora BC: Electronic Atlas of the Flora of British Columbia [eflora.bc.ca]. Lab for Advanced Spatial Analysis, Department of Geography, University of British Columbia, Vancouver. [Date Accessed]
E-Flora BC: An initiative of the Spatial Data Lab, Department of Geography UBC, and the UBC Herbarium.
© Copyright 2021 E-Flora BC.