
DEVELOPING ECOLOGICAL FRAMEWORKS FOR BC VASCULAR PLANTS: ANALYZING BEC PLOT DATA (VERSION 2013)
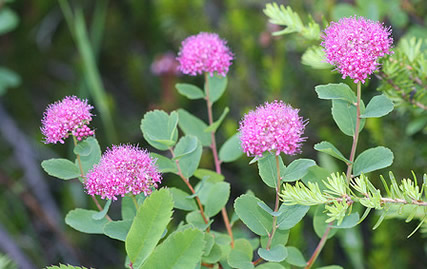
Subalpine spiraea (Spiraea splendens), photo by Brian Klinkenberg
by
Brian Klinkenberg
Introduction
Understanding the ecology or ecological framework of plant species is important in both conservation and research. Plants are influenced in their distributions and occurrences by several key factors, including site moisture, slope, aspect, nutrient levels, and elevation. These factors can be very specific, particularly for rare species, and gaining insight into the range of site conditions required for individual species is important to ecological understanding. Compilation and analyses of data on species requirements is both intrinsically important to the understanding of species ecology, and will allow assessment and prediction of the potential impacts of climate change on BC plant species.
Developing a Framework: The BEC Database
In E-Flora BC, we have developed ecological frameworks for many BC vascular plant species, and this information is presented in a table in our atlas pages (see, for example, the atlas page for bigleaf maple (Acer macrophyllum). The frameworks were developed by analyzing and summarizing data from the provincial BEC (Biogeoclimatic Ecosystem Classification) database. This database has been developed by the BC Ministry of Forests and Range (MOFR) and is comprised of plot data collected by MOFR ecologists during on-going BEC surveys throughout BC. BEC is an hierarchical system that uses climate, soil, and characteristic vegetation information to group ecosystems at various levels, including regionally, locally and chronologically. For each plot, MOFR ecologists documented species occurrences and collected data on slope, aspect, moisture levels, nutrient levels and elevation.
The BEC database is comprised of two tables--one containing data on the ecological characteristics of the 54,044 BEC plots distributed about the province (see the map below) and the other containing a list of the species identified as occurring in those plots. Linking the species records--a total of 6388 taxonomic entities (i.e., species, subspecies, varieties and forms, including ornamentals and escaped garden plants)--with the plot data results in a database of over 1.3 million records. However, once duplicate and erroneous records are removed (e.g., plots located in the ocean or in Alberta, misspelled species names, garden escapes), only 1,047,560 records remain, representing 3300 valid native species. This information was compiled and analyzed statistically, as described below.
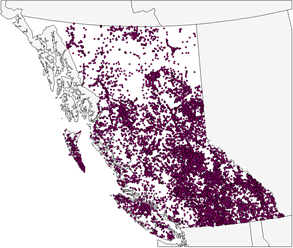
The distribution of the BEC field stations.
As noted above, the BEC database represents over 1,000,000 species records collected in the province. Most of these records are observation only: less than 10% of the records within this database are represented by collections maintained in a herbarium. They nevertheless yield valuable information on site parameters for many BC species. Descriptions of the field data collected at each station are presented on the Ministry of Forest web pages-- Field Manual for Describing Terrestrial Ecosystems.
Analyzing the Data
In order to extract summaries of the ecological characteristics for each species, appropriate statistical routines were identified. This required transformation of some of the variables (e.g., aspect) and application of proper statistical methods. For example, aspect is represented by a number that ranges from 0° to 360°. Because of the nature of circular data like this, one cannot simply derive an average aspect by summing the numbers and dividing by the number of records (e.g., (1° + 359°) / 2 = 180° -- the correct answer should be 0°). Methods designed to work with spherical data must be used when working with aspect. Similarly, appropriate methods must be used when statistically summarizing categorical data, such as nutrient regime class and BEC zone class.
Finally, as with any large database, errors and accuracy of the data are important issues. Considerable effort was put into identifying errors in the BEC database and cleaning the data. Obvious errors were corrected. For example, although only 17 BEC Zones are recognized, there are 32 distinct 'zones' recorded in the BEC database (e.g., some of the incorrectly listed BEC zones included BATA [should be BAFA], CHA [should be CMA], IW8W, SU). Similarly, elevations are recorded that are beyond the highest peak in BC (could have been recorded in feet?). Where possible, these errors have been corrected. In spite of this cleaning, however, many typos and other errors no doubt still remain in the database, given the shear number of records. If the typo produces a result that fits within the parameters for that variable (e.g., an elevation that should be 20 m is recorded as 200 m or SBPS is recorded as SBS), then it unfortunately remains in the database.
Once statistical methods were chosen, and the data cleaned, the plot data was analyzed. A database containing the results of our statistical analysis of the species covered by the BEC plots was then produced. The information from this database is extracted and displayed in table format on the E-Flora atlas page for each species covered by the original BEC plots (not all BC species fall within the BEC survey plots). BEC species summary data is presented in 2231 of the E-Flora atlas pages.
Using the results of the BEC analyses (2010 version), we can now answer many questions related to the distribution of plants in British Columbia. For example, do plant species in the province show a preference for south-facing slopes? We can answer that question by comparing the distribution of the aspects for the 30,564 BEC plots against the distribution of the aspects associated with the 853,765 species records. If the species do not show a preference with respect to aspect one would expect that the two distributions should be similar (i.e., you would find as many plants in plots facing north as you would in plots facing south).
In the figure below, the two distributions have been plotted together--the bars with the white outlines reflect the distribution of aspects derived from the plot alone, while, the green bars sumarize the distribution of the aspects derived from the species records. The differences between the two distributions (plotted as 'rose' diagrams) indicate that more species are found on slopes facing south than on slopes facing east, north and west (i.e., while the BEC plots are, more or less, uniformly distributed about 360 degrees, a greater percentage of species are found in plots that face south).
Validity of the Data
In order to confirm the validity of the information
presented in the BEC database, where possible, a comparison was
made between the BEC records and data available from other databases. For
example, using
Digital Elevation Models (DEMs) of the province, it is possible
to compare the value of the slope as stated in the BEC database
with the slope as determined from a DEM of the province. Since
the resolution of the DEM will affect the value of the slope,
two DEMs were used in this comparison. As illustrated in the
figure below, it appears as though the BEC slope data under-represents
shallow slopes (classes 1-4; class 1 slopes are flat areas) and
over-represents steep slopes (classes 5 and higher). However,
that result is expected since higher resolution data
(in this case the BEC plot slope values) will capture steeper slopes
than lower resolution data, while the lower resolution
data will over-represent shallow slopes over steep slopes. Overall,
it appears as though the BEC data reasonably represents the slope
values (and all other values tested).
Comparison of slope classes derived from BEC data and two DEMs.
Recommended citation: Author, date, page title. In: Klinkenberg, Brian. (Editor) 2021. E-Flora BC: Electronic Atlas of the Flora of British Columbia [eflora.bc.ca]. Lab for Advanced Spatial Analysis, Department of Geography, University of British Columbia, Vancouver. [Date Accessed]
E-Flora BC: An initiative of the Spatial Data Lab, Department of Geography UBC, and the UBC Herbarium.
© Copyright 2021 E-Flora BC.