 |
Self-Quiz
This quiz will test your knowledge on all aspects of lidar technology discussed in this module – it is assumed that you have a good understanding of all sections. Read the questions carefully! Click on one of the answer options to reveal if it is the correct answer. When “Hints” are provided, they may help guide you to the right answer or help explain why the answer choice is incorrect.
Please note that this is a self-quiz – your scores will not be tallied, and it is up to you to keep track of your errors. The quiz is meant to challenge you.
Tip: You can click on any image to open and expand it in a new window!
-
What is CORALNet?
-
Canadian Optical Radiation Aerosol Lidar Network
Try again
-
Canadian Observational Radar And Lidar Network
Try again
-
A network of lidars across Canada
Correct!
CORALNet is the Canadian Operational Research Aerosol Lidar Network, with stations across Canada from coast to coast.
-
A net-scattering lidar that is used at the UBC site
Try again
Hint: The CORALNet-UBC lidar is an elastic backscattering lidar.
-
The CORALNet-UBC lidar emits a laser pulse at:
-
532 nm and 1064 nm, simultaneously
Correct!
The lidar emits a laser pulse at these two wavelengths simultaneously, but receives a signal at three channels (532 nm, polarized and depolarized, and 1064 nm)
-
532 nm (both channels) and 1064 nm, simultaneously
Try again
Hint: Think about what “both channels” means. Remember, lidars only emit nearly 100% polarized light.
-
532 nm and 1064 nm, alternating
Try again
-
532 nm (both channels) and 1064 nm, alternating
Try again
Hint: Think about what “both channels” means. Remember, lidars only emit nearly 100% polarized light.
-
Which of the following is NOT an aerosol?
-
Smoke
Try again
-
Volcanic tephra
Try again
Hint: Tephra is the type of rock fragment of which volcanic ash is composed.
-
PM2.5
Try again
Hint: What does “PM” stand for?
-
Sulfur dioxide
Correct!
Sulfur dioxide, SO2, is a chemical compound released from volcanic eruptions. It is an air pollutant, but NOT an aerosol since it is a gas. However, it is a precursor to forming sulfate aerosols.
-
Sea spray
Try again
Hint: Sea spray includes the presence of mineral salts in ocean water.
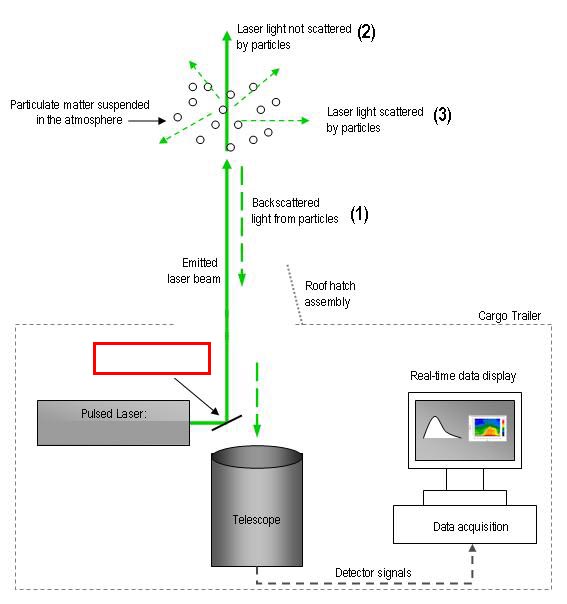
Questions 4 – 5 will use the schematic diagram of the lidar setup below:
-
What is the name of the part labeled by the red box?
-
Beam splitter
Try again
-
Steering mirror
Correct!
The laser pulse emitted is steered out of the cargo trailer by reflecting off of the steering mirror.
-
Amplifier
Try again
-
Pulse reflector
Try again
-
From the diagram above, which of the light scattering pathways (labeled (1) – (3)) would you use to define the depolarization ratio:
-
(1) only
Try again
Hint: This would tell us something about backscattering
-
(2) only
Try again
Hint: This would imply that we are only looking at light scattering that the lidar never receives
-
(3) only
Try again
Hint: Does using only one component of scattering give a ratio?
-
(3) and (1)
Correct!
The depolarization ratio is the “ratio between the perpendicular (3) and the parallel component (1)” of emitted light.
-
(3) and (2)
Try again
-
True or False: Receiving backscattering ratio at multiple wavelengths tells us about the geometric shape of the aerosols.
-
True
Try again
Hint: The depolarization ratio of the lidar signal will help us infer the shape of aerosols
-
False
Correct!
Since the laser pulses can only measure objects that are their own wavelength or larger, measuring the backscattering ratio at multiple wavelengths and then comparing them will tell us about the size distribution of the aerosols.
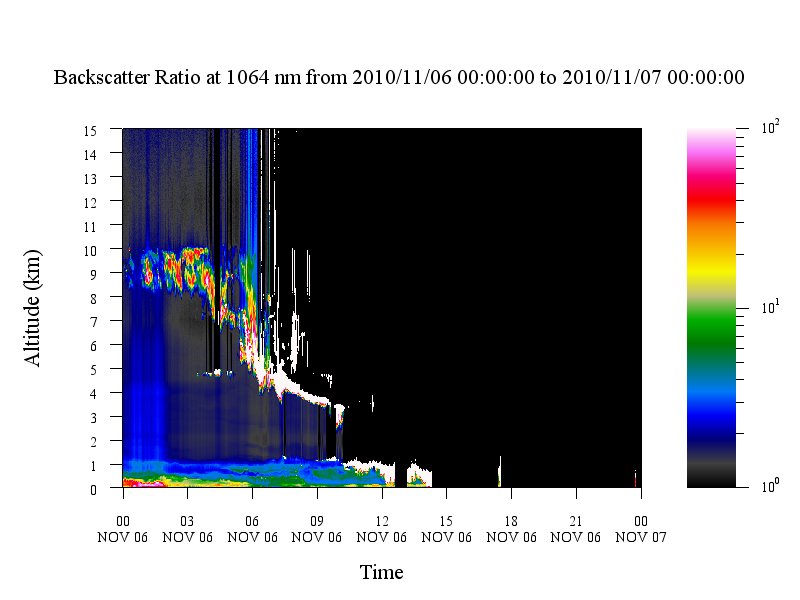
Questions 7 – 11 will use the schematic diagram of the lidar setup below:
-
What is the backscattering at approximately 02:30 at ~9000 m? (Choose the best answer)
-
1.5%
Try again
-
0.10
Try again
-
4.0
Try again
Hint: Remember, the backscattering ratio scale is from 0.0 – 1.0 (or 0 – 100%)
-
40%
Correct!
The backscattering ratio is approximately 40% (or 0.40), which corresponds to a red tone on the adjacent colour scale
-
What is the cloud-base height at 09:00? (Choose the best answer)
-
1000 m
Try again
Hint: We expect the cloud-base height to correspond to maximum backscattering ~100%)
-
4 km
Try again
Hint: Would this indicate the cloud-base?
-
3.5 km
Correct!
At 3.5 km we observe the bottom-most “edge” of maximum backscattering (~100%) which corresponds to a cloud-base aloft
-
Not enough information to tell
Try again
-
What is the cloud depth at 09:00? (Choose the best answer)
-
500 m
Try again
Hint: What does the large black area above indicate?
-
1 km
Try again
Hint: What does the large black area above indicate?
-
5 km
Try again
-
Not enough information to tell
Correct!
Remember, cloud-base height is the most reliable information derived from backscattering output. Measurements for the cloud-top height or cloud depth are uncertain because of signal attenuation through the cloud layer.
-
The jagged area of maximum backscattering just after 12:00 at ~500 m is likely caused by:
-
Virga
Correct!
High backscattering at extremely low altitudes is usually not attributed to cloud decks. Also, stratus clouds typically have a uniform (or flat) cloud-base. The maximum backscattering around 12:00 is not uniform, and is likely virga, possibly composed of ice crystals.
-
Fog
Try again
Hint: What kind of signature would fog make on 1064 nm output?
-
A very low cloud-base
Try again
Hint: High backscattering at extremely low altitudes is usually not attributed to cloud decks. Also, stratus clouds typically have a uniform (or flat) cloud-base. Does this area of high backscattering look uniform?
-
An advected anthropogenic industrial plume
Try again
Hint: These types of plumes do not exhibit backscattering values of ~100%
-
Using the results from the question above, what would be the most likely cause of the black portions of the backscattering output for the majority of the rest of the imagery?
-
Signal attenuation from low cloud cover
Try again
-
Precipitation
Correct!
The preceding virga and apparent lowering cloud deck is indicative a passing front and the commencement of precipitation. We can always check our interpretation with ancillary data, such as webcam photos or data from the lidar station’s meteorological tower.
-
Maintenance/error
Try again
Hint: This could be true, but use the correct answer from Question 10 to guide you.
-
Not enough information to tell
Try again
Hint: Remember, there was virga slightly before the black portion of data!
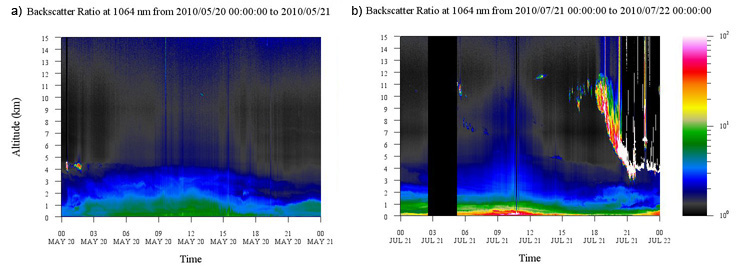
Questions 12 – 13 will use the two CORALNet backscattering ratio outputs at 1064 nm, taken from two different CORALNet stations, below:
-
From image (b), what is the maximum height of the Mixed Layer (ML)?
-
0.5 km
Try again
Hint: This corresponds to the maximum height of the maximum backscattering red tones (~40%) at ground-level, but not the maximum height of the ML
-
1.5 km
Correct!
The daytime ML is distinguished from the free atmosphere above due to the higher concentration of aerosols that are emitted from the surface (warmer tones). We consider the free atmosphere as relatively clear of aerosols (blue tones). The boundary between these two is the mixing height (zi), which is the maximum height of the ML. In image (b), this occurs at ~11:00 at 1.5 km altitude.
-
11 km
Try again
Hint: Recall that the ML is the daytime PBL, which develops between the lowest 300 – 3000 m of the troposphere – so, an ML at 11 km does not make much sense. The ‘swath’ of backscattering of ~1-2% around 10:00 is likely an error.
-
There is not a developed ML since it is a cloudy day
Try again
Hint: Well-developed cloud structures only appear in this image past ~18:00 and thus will not affect the development of the daytime ML
-
Based on images (a) and (b), we would likely conclude that:
-
Both (a) and (b) are inland locations
Try again
-
Both (a) and (b) are coastal locations
Try again
-
(a) is a coastal location, and (b) is an inland location
Try again
-
(a) is an inland location, and (b) is a coastal location
Correct!
Notice that the maximum ML height in image (a) is ~2.5 km, and that in image (b) is ~1.5 km. In fact, the output in (a) is from CORALNet-Egbert, and (b) is from CORALNet-UBC! Coastal locations tend to have shallower ML’s due to the cooler, marine air advecting onshore via the sea breeze circulation, which may suppress the rising ML.
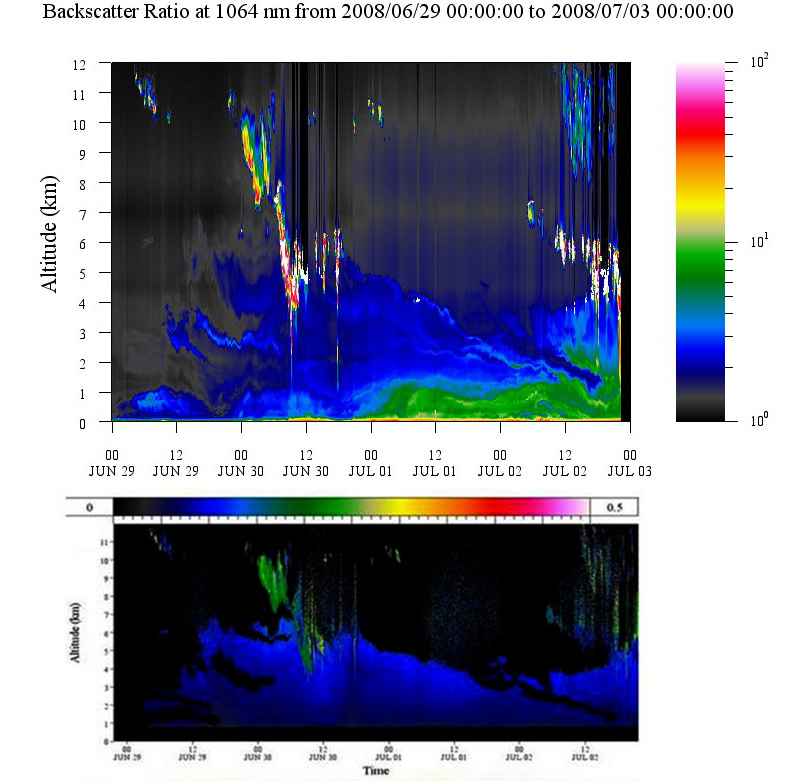
Questions 14 – 16 will use the following CORALNet-UBC backscattering ratio output at 1064 nm (top panel) and corresponding depolarization ratio output (bottom panel) below. Note that the output spans several days.
-
Carefully examine the images above. What type of feature(s) is(are) distinguishable?
-
PBL features
Try again
Hint: Can you identify any other feature at higher altitudes?
-
A smoke plume
Try again
Hint: Can you identify any other feature at lower altitudes?
-
A dust plume
Try again
Hint: What does the depolarization ratio output tell you about the shape of the particles?
-
(a) and (b)
Correct!
The small “bumps” of low backscattering aerosols below ~1.5 km in the top panel reveal the varying diurnal structure of the PBL. The maximum backscattering at this level is consistently observed before 12:00 of each day. A larger-scale feature is present starting at approximately 4 km at 11:00 on June 29th. This feature extends up to ~6 km, and eventually subsides over the time period, which brings an increase in backscattering near ground-level between July 1st and 3rd. From the bottom panel of depolarization ratio, only low depolarization is observed over the course of the event. Thus, we can conclude that this is likely a smoke plume.
-
(a) and (c)
Try again
Hint: What does the depolarization ratio output tell you about the shape of the particles?
-
Using your answer from Question 14 and by examining the depolarization ratio output (bottom panel), we can conclude that the majority of aerosols present are:
-
Spherical, only anthropogenic in origin
Try again
Hint: Think of the correct answer from Question 14!
-
Spherical, only biogenic in origin
Try again
Hint: Think of the correct answer from Question 14!
-
Spherical, anthropogenic and biogenic in origin
Correct!
In Question 14 above, we identified PBL features (the ML), and a smoke plume. Both of these will exhibit low depolarization ratios (blue tones). The PBL is anthropogenic in origin, and the smoke plume is likely biogenic.
-
Irregular, biogenic in origin
Try again
Hint: Be careful! What does a low depolarization ratio (blue tones) tell you about the shape of the aerosols?
-
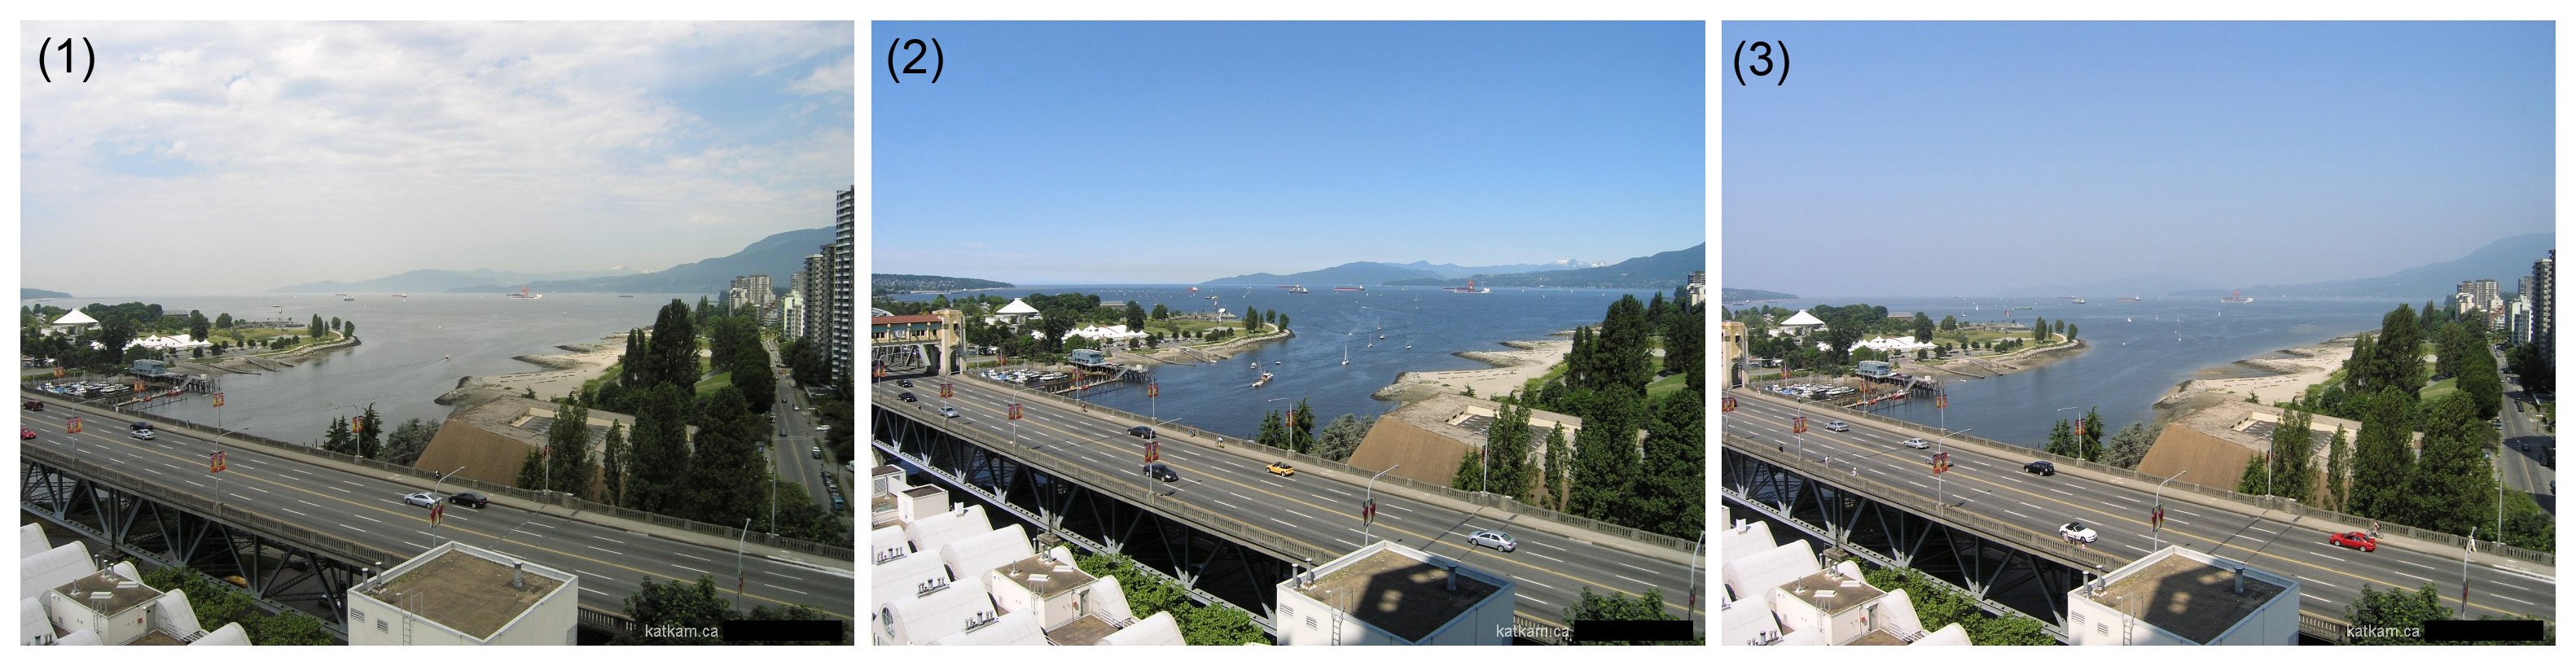
Carefully examine the images below, taken from the KatKam webcam at 12:00 noon on various days over the course of the event above. Use the backscattering output in the top panel to help you. In chronological order, the images that corresponds to June 29th 12:00, June 30th 12:00, then July 1st 12:00, are:
-
1, 2, 3
Try again
-
1, 3, 2
Try again
-
2, 1, 3
Correct!
At 12:00 on June 29th, the atmosphere is relatively free of aerosols (blue tones) in the lowest 1 km, with no clouds aloft. We would expect good visibility in these conditions, which we can picture in image (2). At 12:00 on June 30th, there is a thin layer of higher backscattering below 1 km (yellow tones), as well as clouds aloft around ~5 km. The only image above that pictures clear cloud structure is image (1). At 12:00 on July 1st, a thick layer of aerosols has developed extending up to ~1.5 km (green tones, ~10%). However, there are no clouds present. Of the three images above, (3) shows the most decreased visibility but no cloud cover.
-
2, 3, 1
Try again
Hint: Use cloud-cover as a guide.
-
3, 1, 2
Try again
Hint: Would we expect the better visibility as the event progresses?
-
Finish the following statement: “During intense burning, asymmetrical smoke particles...”
-
Are not observed; smoke particles are spherical in all burning conditions.
Try again
-
Will accumulate into a spherical mode
Correct!
The asymmetrical and chain-aggregate particles will accumulate into a spherical mode, which will not depolarize the light; the resulting depolarization ratio will be low
-
Will directly result in a low depolarization ratio
Try again
Hint: The problem with this choice is the word “directly”; asymmetrical (irregular) particles would not directly result in a low depolarization ratio.
-
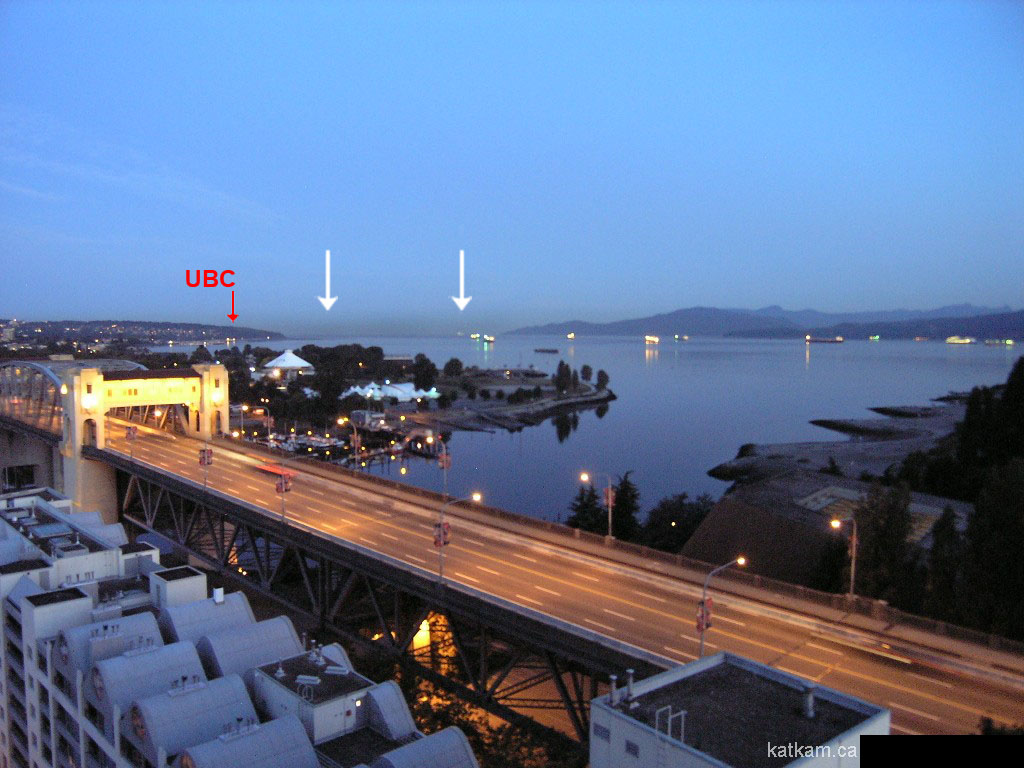
The KatKam image below (top panel) was taken during a dust event between sometime between August 27th and 29th, 2007. In the distance above the Strait of Georgia and at the mouth of the Burrard Inlet is a veil of brown haze (indicated by white arrows), with slightly reduced visibility in the rest of the frame. Also below (bottom panel) is the lidar backscattering ratio output over the duration of the dust event. Of the options given, what date and time does the KatKam image best correspond? (Assume that the KatKam image has not been modified in any way)

-
August 27th, 22:00
Try again
Hint: Be careful, webcam images are not available after sunset. This time also has clouds aloft, whereas the KatKam image does not show any.
-
August 28th, 06:00
Correct!
At 06:00, the sun has not completely risen yet. We know that it is still dark by noting that the streetlights are still lit in the KatKam image. In the lidar output, we see that there is a higher concentration of aerosols near ground-level (yellow-green tones), but no clouds aloft at this time. This most definitely corresponds to the KatKam image, where there are no clouds but a veil of brown haze in the distance.
-
August 28th, 14:00
Try again
Hint: Though this time on the lidar output does show a higher concentration of aerosols near ground-level, there are clouds aloft, which is not true for the KatKam image. This time would also be in the afternoon. What do the lit streetlights in the photograph tell you about the time of day?
-
August 28th, 22:00
Try again
Hint: The lidar output suggests that it is raining at this time – precipitation is not visible in the Katkam image. It would also be much darker at 22:00.
-
From the information above in Question 18, the expected shape of aerosols would be __________ which would correspond to __________ depolarization ratios:
-
Irregular, high
Correct!
Dust particles are irregular (non-spherical) in shape, which give them the ability to scatter a larger proportion of laser light in other directions, which results in a higher depolarization ratio (typically >0.2, or >20%).
-
Irregular, low
Try again
-
Spherical, high
Try again
-
Spherical, low
Try again
-
Why is a smoke plume more visibly distinguishable (slightly higher backscattering ratio compared to the cleaner atmosphere) in backscattering output compared to a dust plume?
-
The smoke plumes are thicker than dust plumes so that there is a larger concentration of aerosols to backscatter the laser light
Try again
Hint: Smoke plumes are not necessarily thicker than dust plumes, and thickness does not necessarily correlate to the concentration of aerosols.
-
There is enhanced Rayleigh scattering by higher influence of smaller particles of a smoke plume
Try again
Hint: Rayleigh scattering will not necessarily affect the amount of backscattering received by the lidar. Having trouble remembering the principles of atmospheric optics? Take a look at this site.
-
There is enhanced forward scattering by higher influence of larger particles in a smoke plume
Correct!
As we explained in the Interpretation of Dust Plumes section, smoke plumes are slightly more visible in backscattering output compared to dust plumes because forest fire plumes are made up of a higher proportion of larger particles. These larger particles are then able to scatter light forward (backscattering to the lidar) more efficiently. You can also review some basic principles of Atmospheric optics at this site.
-
Smoke plumes are usually lower in the atmosphere whereas dust plumes are transported at high altitudes via the Jet Stream which enhances their light scattering abilities
Try again
-
In the interpretation of volcanic aerosol plumes section, we presented lidar output observed at CORALNet-UBC following the Koryaksky volcanic eruption, also shown below. Carefully study the image again:

In the table below, match up the labeled number from the image (on the right) with the corresponding name of the feature (on the left). (Drag and drop!)
Congratulations! You’re finished the Lidar Self-Quiz!
Have more questions? View the Additional Resources page >>
|
|
|
