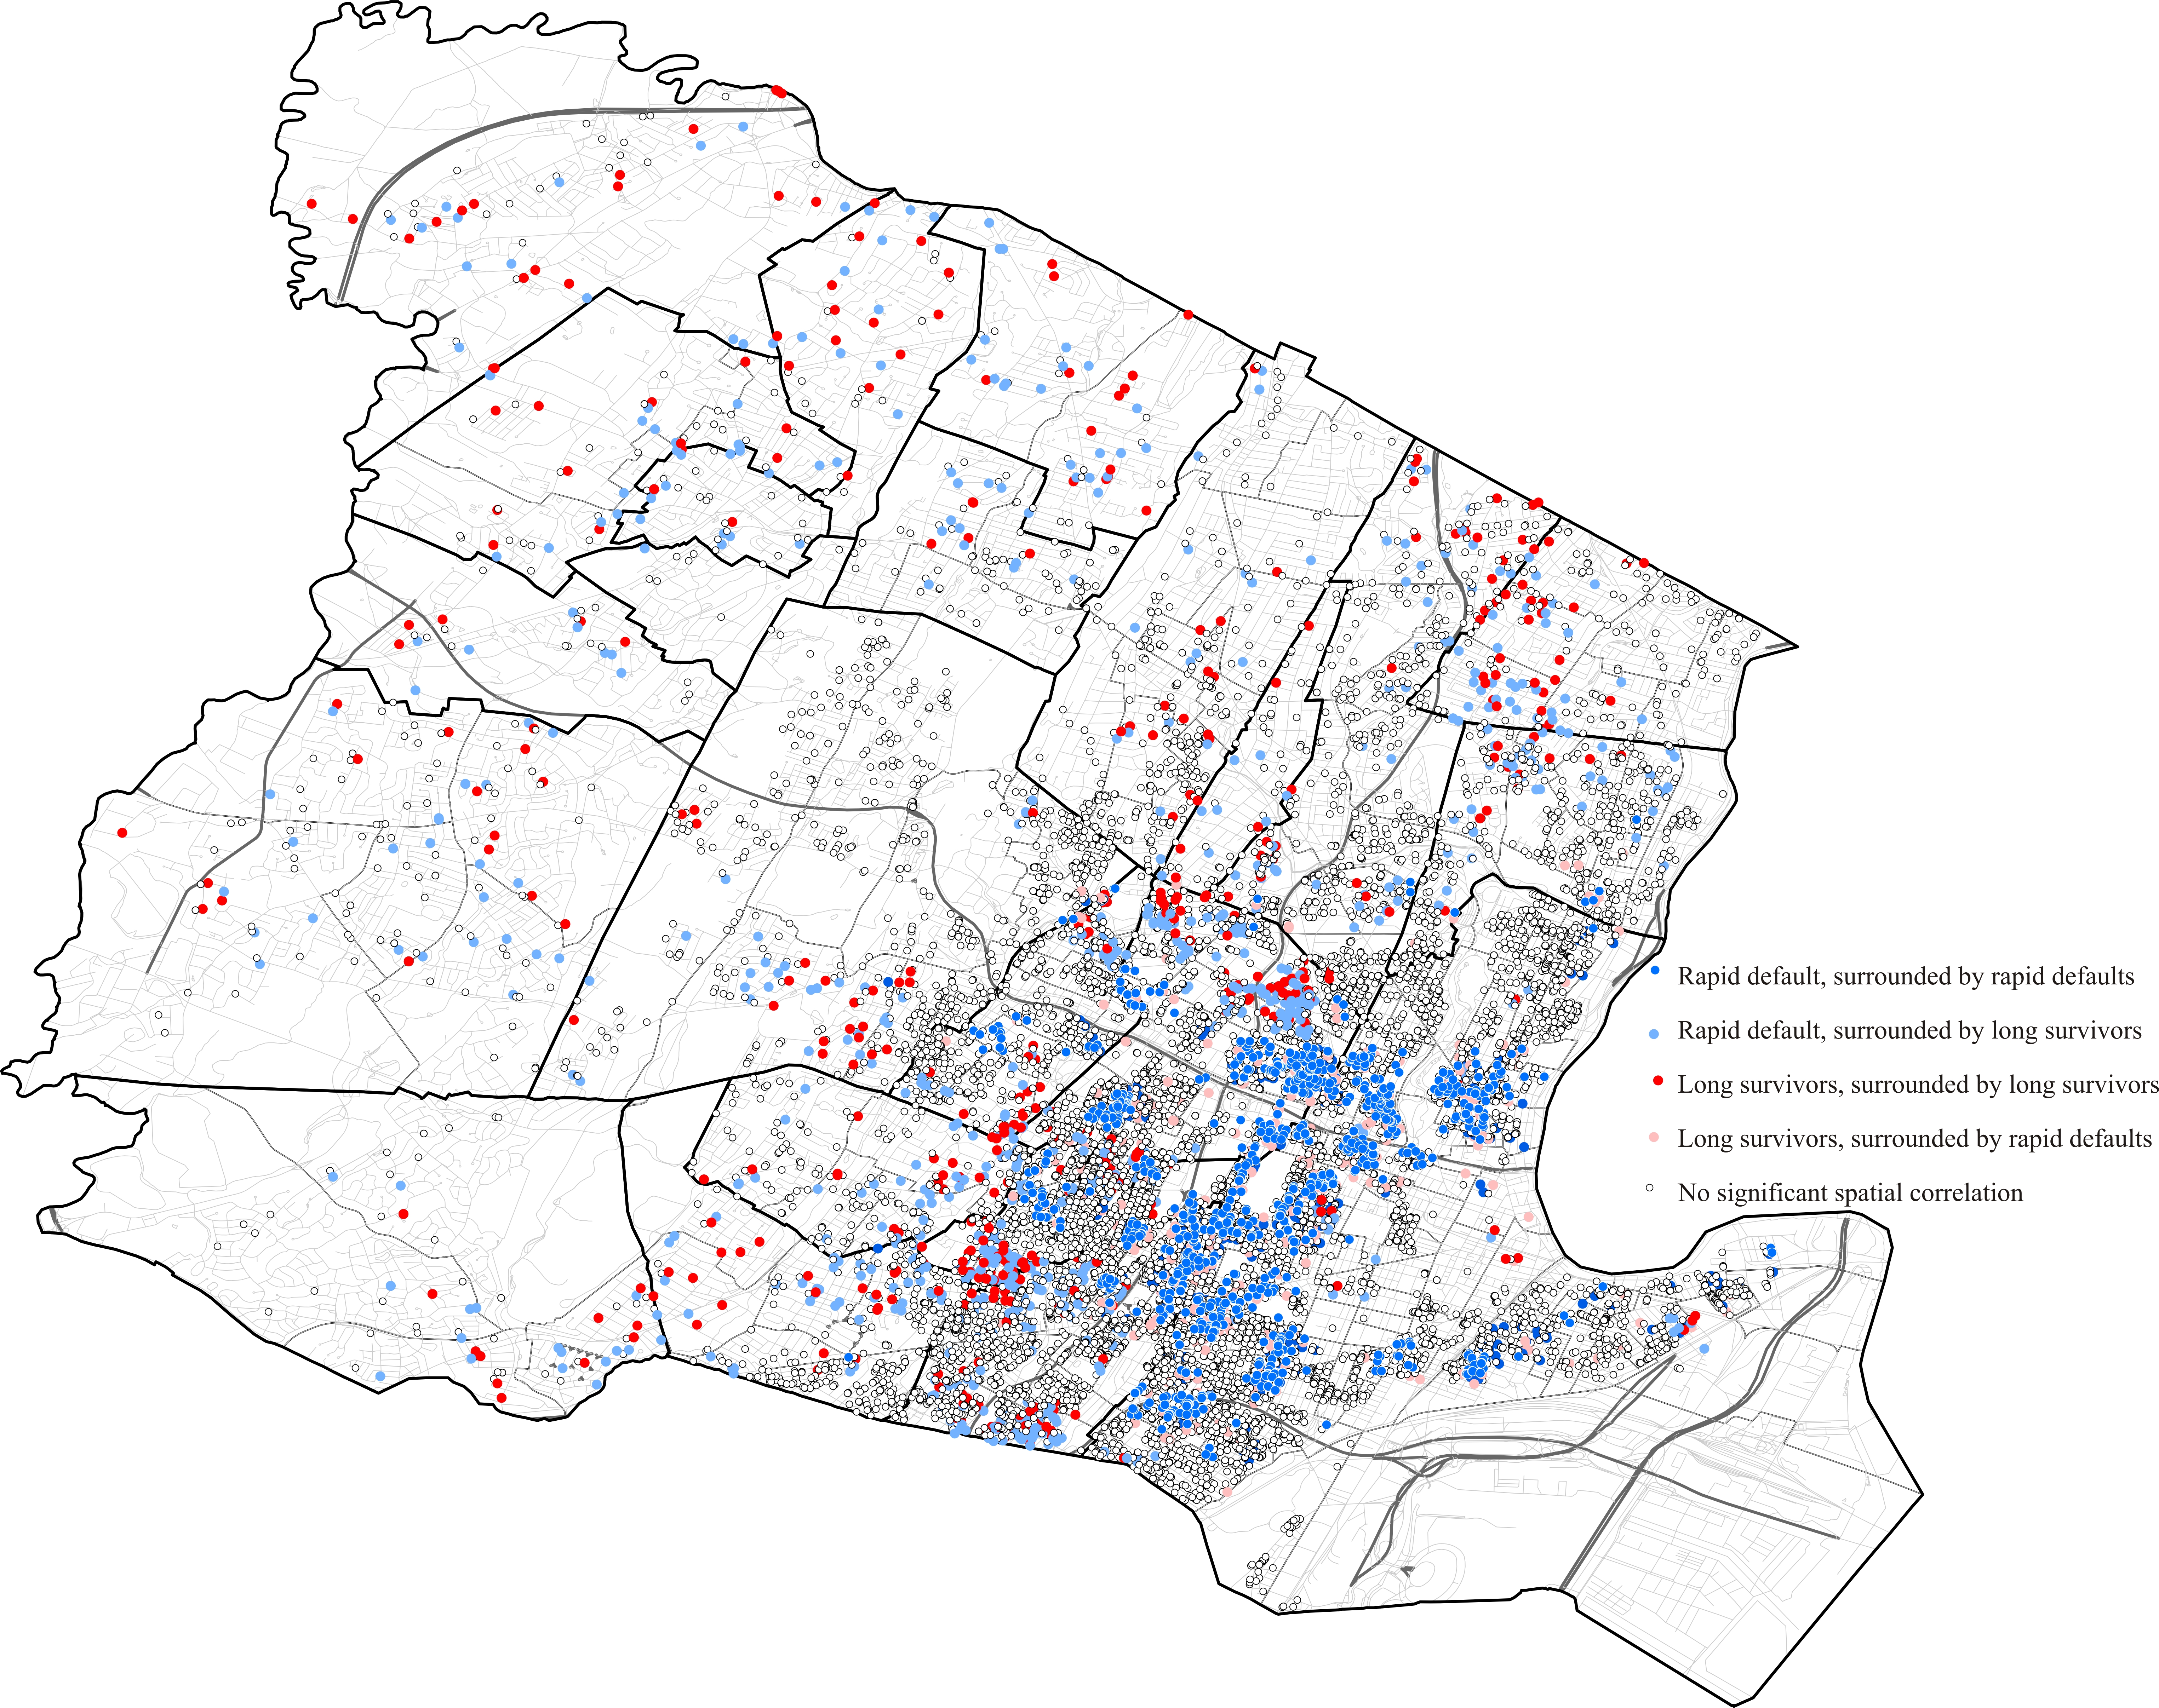
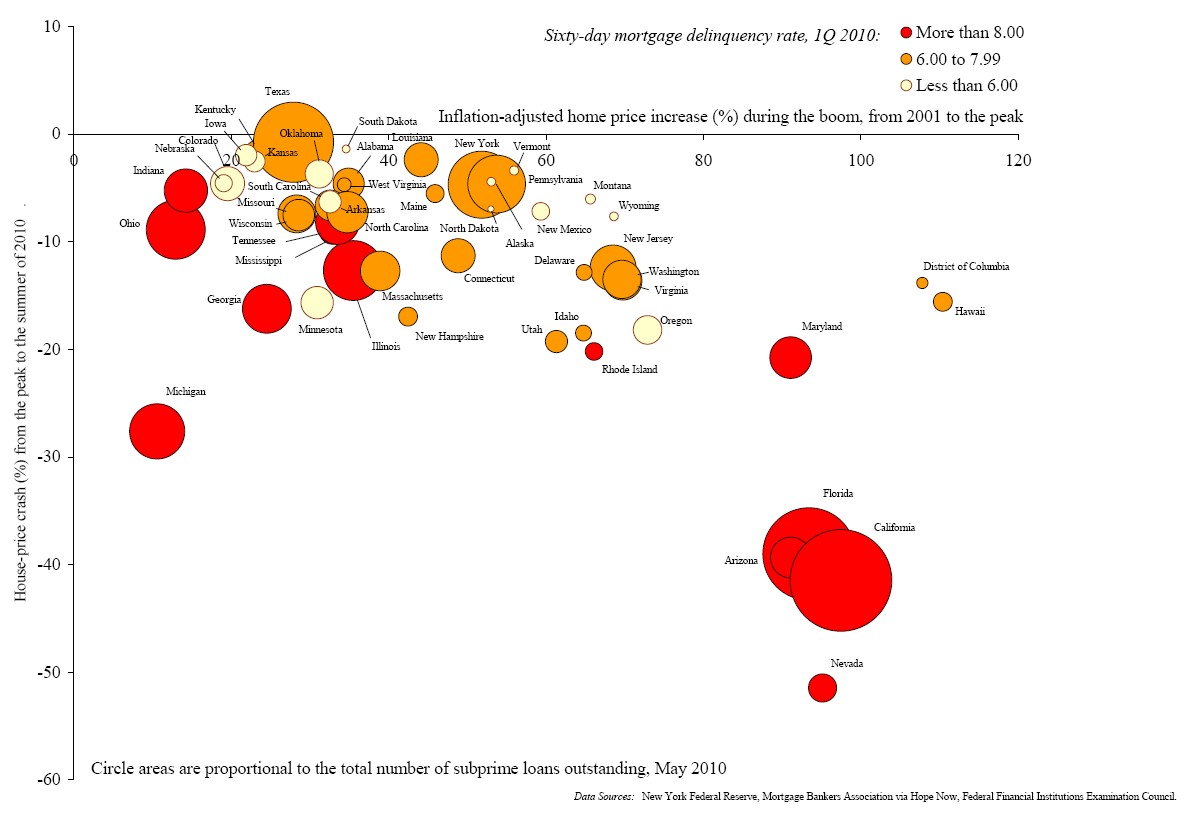
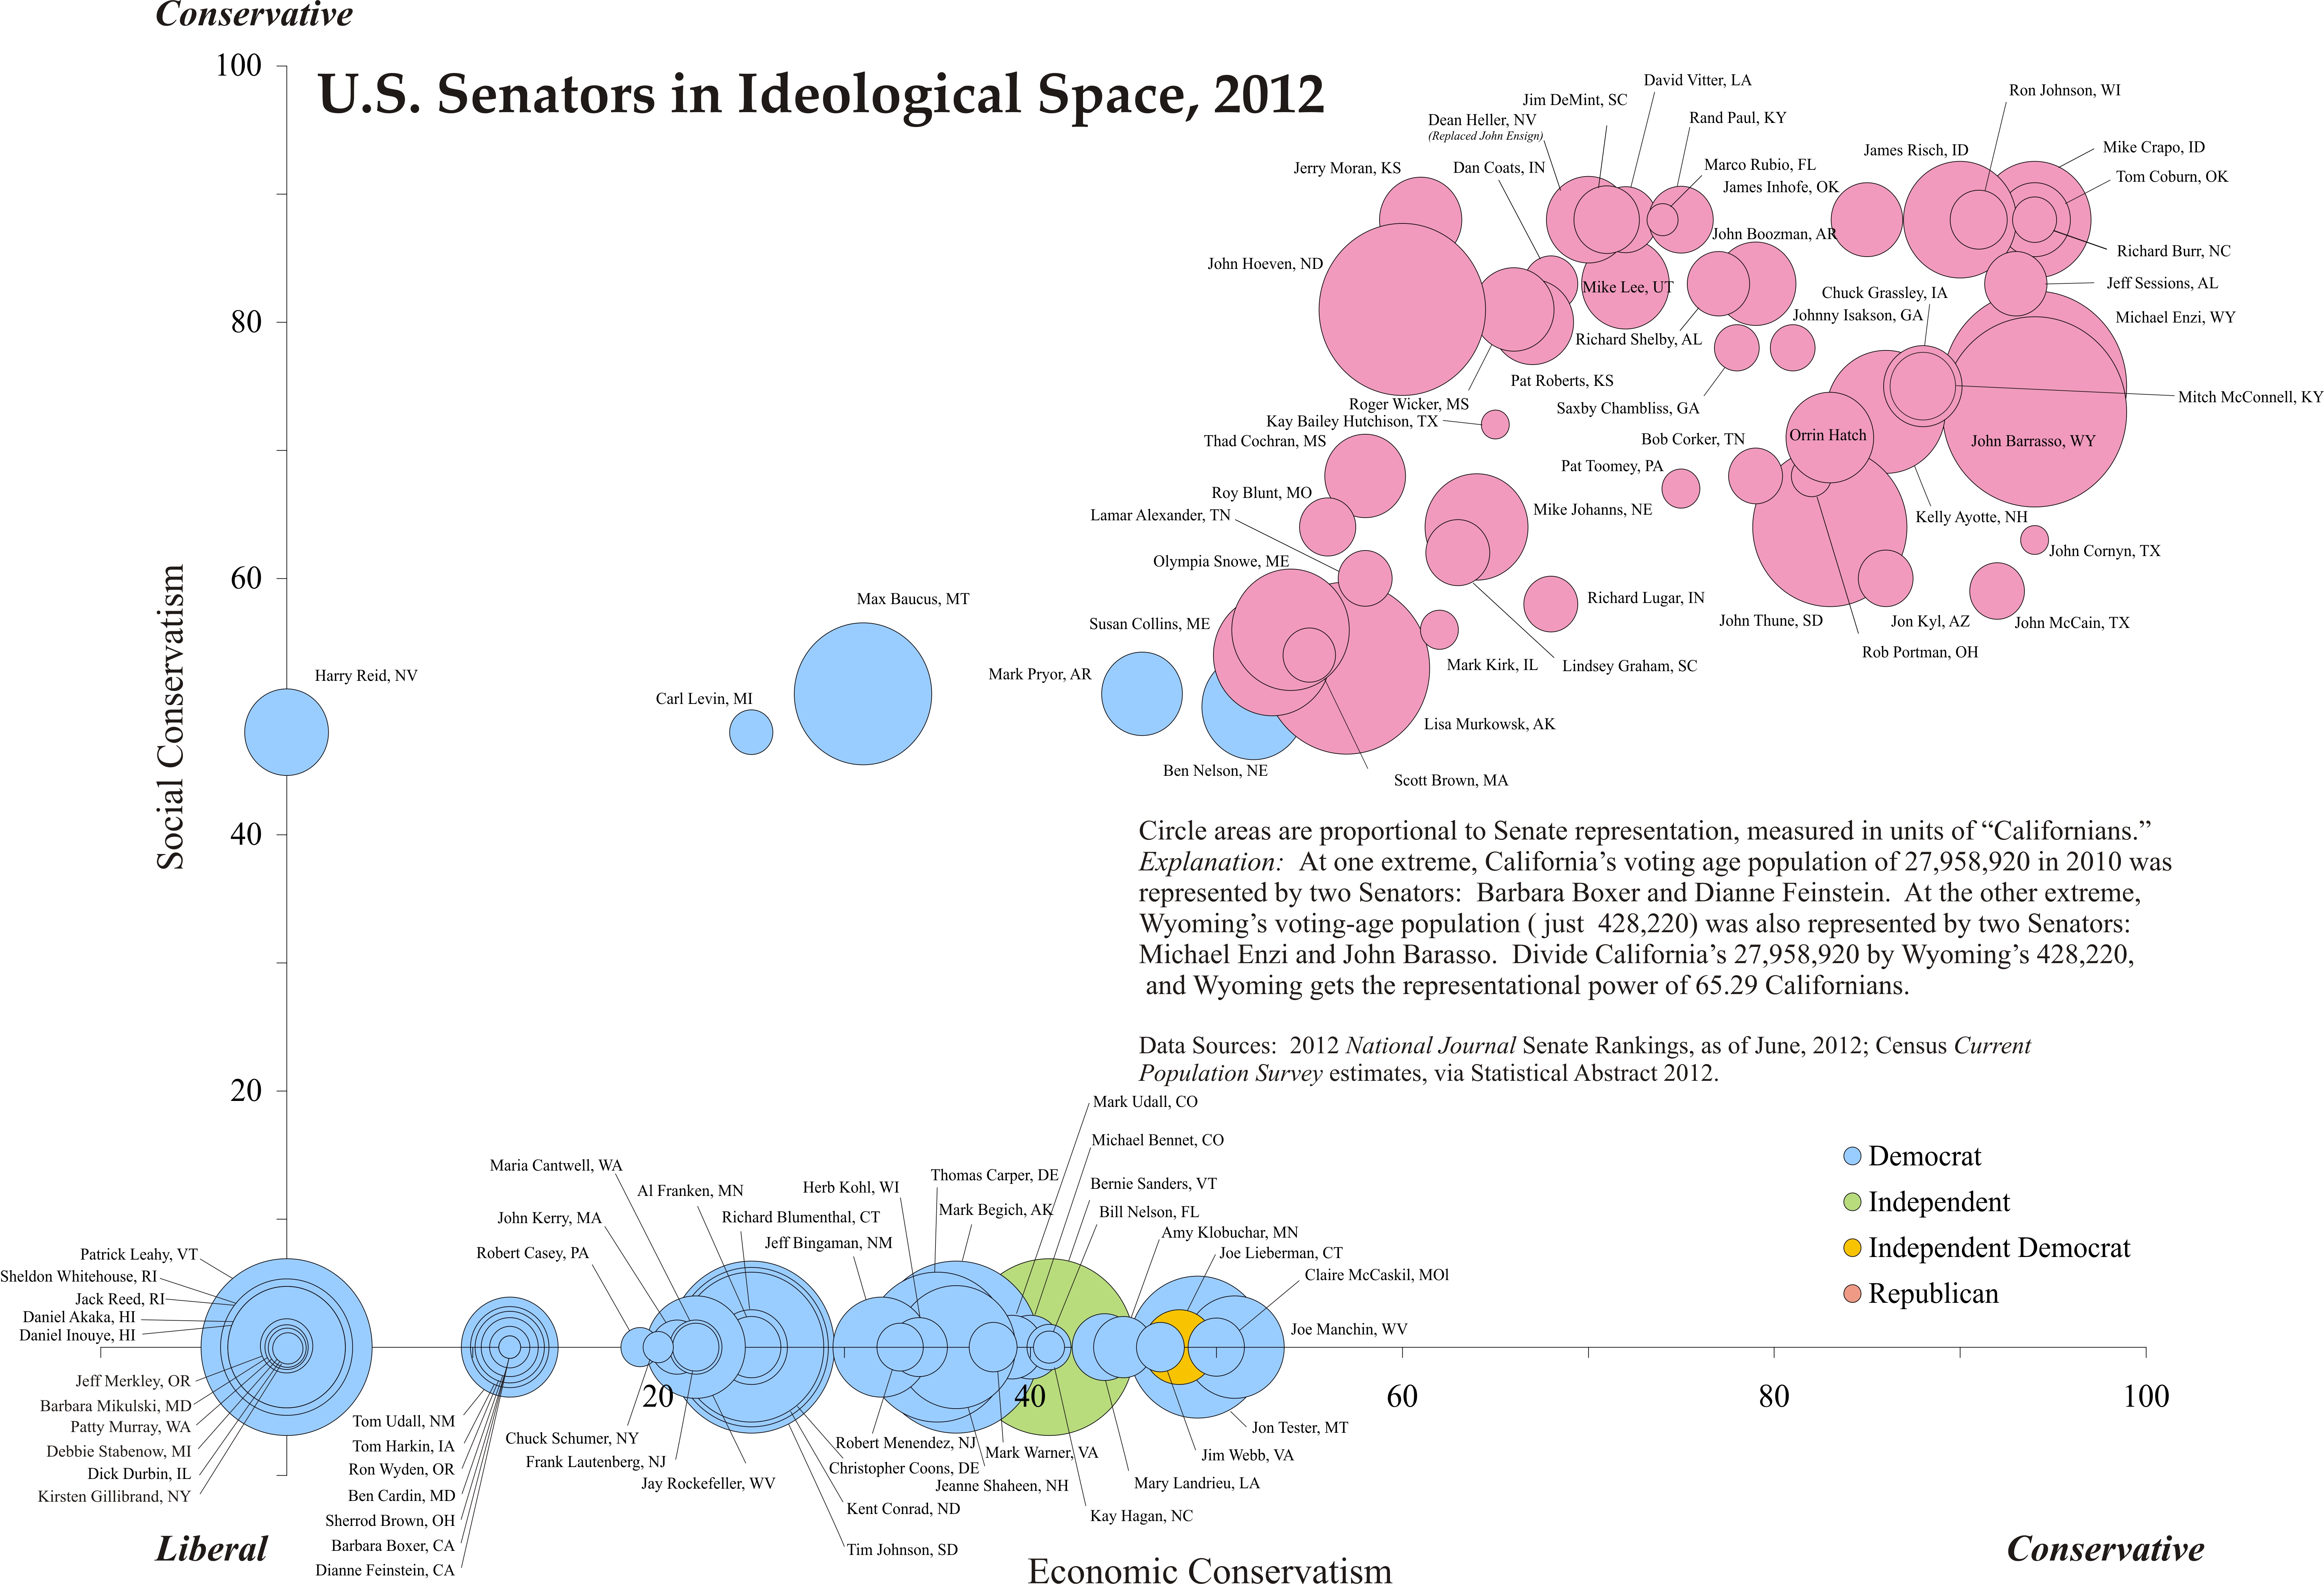
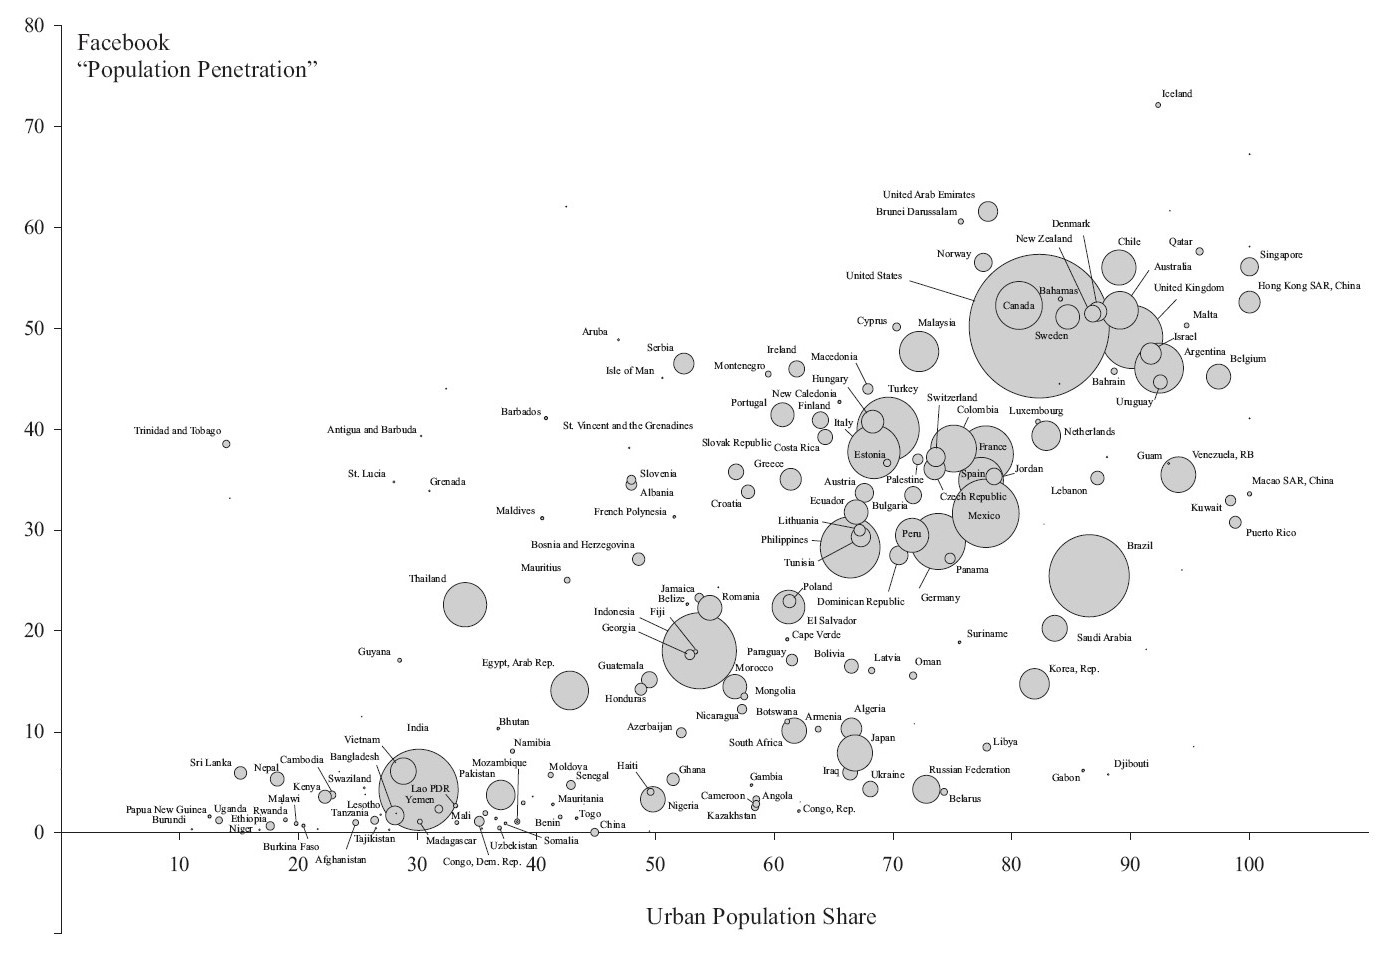
If you spend a few minutes following the digital breadcrumbs on this website, you'll notice that I'm a bit of a data junkie. Perhaps you share a few of my obsessions. Do you like Rachel Maddow's "Moment of Geek" segments? Do you like to create maps and charts? When you see the latest website or app with a sophisticated animation that helps visualize data, do you think to yourself, "how can I get my paws on the tools they used to create that?"
Yep, me too. Sadly, I never quite internalized the speed and skill of the true computer programmer, the neurotransformation of the genuine hacker. I'm the essence of the amateur. So I can't even understand the broad terms in which software experts discuss the very latest data visualization tools. But I do have a few primitive skills that come in handy from time to time for some very simple visualizations. Below are a few examples.
You might be interested in this G448 option if
1. You know one or more software tools for analyzing and/or visualizing data,
2. You like using these tools to create things and to describe the results, and/or
3. You're willing to work as my Research Assistant -- tracking down data and looking over my shoulder as I use my cro-magnon tools to pound out very simple tables and charts and maps and graphs, Oh My!
For this option to work well, you need to share some of my obsessive-compulsive tendencies. Most importantly, you have to be obsessive about the quality, integrity, and validity of data. This doesn't mean you have to know precisely the same technical stuff I do. Indeed, it's best if you know some tools that I don't; maybe you can teach this old dog some new tricks! But what really matters is that you have the drive to find, organize, and document things carefully. We live in an age of wars of representation and interpretation, and many the military dictatorships routinely lie with every map and statistic they can get their hands on. We need to fight back with the powerful nonviolent insurgent tools of quality, rigor, integrity, and radicalism.
Give me a call if you're interested, and we can chat about the possibilities.