SUPPLEMENTARY ACTIVITY: CITIZEN SCIENCE AND BIOGEOGRAPHY
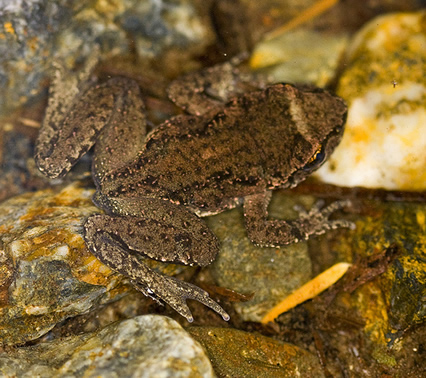
The Coastal Tailed Frog, a rare species in British Columbia.
View the atlas page.
Links to BC Curriculum:
K-12 Science Curriculum (Life Sciences and Processes of Science).
Prescribed Learning Outcome:
Diversity and distribution of local plants and animals; scientific inquiry process.
Time frame:
The length of the suggested activities can be adapted to according to grade level. |
Overview and background information (for teachers and students):
- Citizen science is, simply put, “scientific research conducted by amateur or nonprofessional scientists”. Anyone can engage in scientific research and make important contributions to a body of knowledge.
- Biogeography is the study of the distributions and occurrences of plants and animals, and what drives those. It includes exploring how climate change affects distributions, the influence of annual rainfall, how winter temperatues play a role in species occurrences.
- E-Flora BC and E-Fauna BC are biogeographic atlases of the flora and wildlife of BC. That is, they show which wild species of plants, fungi, and animals are found in the province, and where they occur. They also show correlations between occurrence and distribution of species and physical or landscape factors in the province.
- While the information provided in the atlases was compiled by scientists, E-Flora BC and E-Fauna BC include a significant citizen science component. That is, volunteers provide additonal important data about wild species in BC through contributions of photo records that document where they are found in BC. Through this, the public can contribute, along with scientists, to the knowledge base for wild species in BC. Contributed photos both illustrate a species and can help document where exactly it is found in the province. Photo records by citizen scientists are added to the distribution maps.
- Teachers can find a complete description of E-Flora BC here, and E-Fauna BC here.
- Teachers can also find a discussion of citizen science on E-Flora here, and a discussion of citizen science on E-Fauna BC here.
- Through the activities suggested in this document, students will not only learn about the diversity of plants and animals of British Columbia, and their geographic distributions in BC, but will also be making valuable contributions to the knowledge base for BC's wild species through photo contributions. They can become citizen scientists.
- By engaging in the suggested citizen science or VGI activities, students will be contributing to our current knowledge of where species are found and how this will change as the climate changes.
Methods:
Field work and preparation:
- Classes or individuals will take photos of plants, fungi and animals during field trips or during any outdoor activity. The field trip could be planned specifically for taking photos, or photos could be taken during any other scheduled outdoor activities.
- Photos to be submitted to the atlases for publication and mapping need to be clear and not blurry and the object of the photo needs to be large enough to see detail needed for accurate identification of the species.
- Any wild species is suitable for this project, as long the photo is acceptable (which teachers can vet the photos before submission).
- Photos will be submitted to either the E-Flora (plants and fungi) or E-Fauna (animals) atlases. Each photo constitutes a photo record for a species and is considered valid data for that species.
- In order to be able to submit photos, teachers will need to register as photographer so that photos can be uploaded to the atlas database. Register for E-Flora BC here. Register for E-Fauna BC here. Once registered, a password will be sent so that photos can be uploaded.
- If the photos are of good quality, they will then be reviewed by experts to see if the object of the photo can be identified to species. If so, then they are published in the photo galleries of the atlases.
- Students and teachers can also work on recording the coordinates of the geographic site were the photo was taken and, thus, of the location of the plant or animal that was photographed. This will provide important information that helps determine the distribution of the species.
- Coordinates can be recorded in different ways, using smart phones, GPS units, topographic maps, or Google Maps. by using a GPS. Read about using Google Maps to determine location coordinates on this citizen science page.
- If coordinates are recorded and submitted with the photo record, then the student's dot will appear on the map for that species.
In class activities:
Allow students to think about the roles that different plants and animals play in the different ecosystems where they occur, and how they relate to other species. Guide the discussion with questions like:
- What is plant geography or phytogeography? What is animal geography or zoogeography?
- What does this mean in terms of which species you might see in the school area/the field trip area?
- Why are some species “rare" and others "common”? (That is, are they naturally rare because the habitat they need is uncommon, are they rare because they are at the northern limits of their range, or are they rare because of habitat loss, especially in places like the Fraser Valley or the Okanagan).
- How will warming temperatures change species distributions? (think about frost - free days, precipitation, etc.).
- How does substrate, moisture levels, soil type, drainage, etc. influence distributions?
- Will BC lose or gain species because of climate change?
Students can also study the atlas or species pages in each atlas to learn more about an individual species, where it is found in BC, and its provincial status. The province documents the status of wild species.
- Students can begin by learning about species distributions. They can look up the atlas pages for their favourite species.
- On E-Fauna BC, try searching for Black Bear, Coyote, Great Blue Heron, Coho Salmon, Steller's Jay, Snowshoe Hare.
- On E-Flora BC, search for species such as big-leaf maple, Ponderosa pine, arbutus, or garry oak. You can even look up the common dandelion.
- Students can compare the distributions of a common species and a rare species, or compare southern species to more widely distributed species. For example, on E-Flora look at big-leaf maple versus red alder. These two species have very different geographic distributions in BC, with big-leaf maple found only in the southwestern corner of the province, while red alder is found from northern BC to southern BC along the coast.
- Students can learn about provincially-listed rare species or SPECIES-AT-RISK.. Or they can learn about federally listed species under the Canadian Species-at-risk Act.
- What is a species-at-risk?
- Check a few example of species-at-risk in the atlases. Go to the ADVANCED SEARCH page and call up all species-at-risk. These are designated as blue-listed or red-listed species. Provincial status is described in terms of 'blue' or 'red'. What do 'blue' and 'red' status mean?
- Cick on the atlas page button to view the atlas page for a species-at-risk. For example, go to the atlas page for the Coastal Tailed Frog--which is a BC species at risk.. What is the distribution of this species in BC?
- Learn about invasive species. Visit the introduction the invasive species section on E-Flora BC.
- Learn where invasive species occur in the province. For example, search the atlases for invasive species such as Giant Hogweed, purple loosestrife, European Starling, or Red-eared Slider and find out where they occur.
- For higher level students, other activities involving the use of the atlas and atlas pages (the species page) could include exploring our distribution mapping. This is best done by viewing the full-sized interactive map to look at where species occur relative to the physical conditions found in the province. By clicking on the link below the small map on the atlas page they can access the large interactive map and add different layers to the map. Using this, they can turn on information layers, such as 'frost-free days'. Examine how these correlate with species distributions.
- The base map used in the full-size interactive maps is a general base map which shows locations (towns and cities). In an interactive map, the base map can be changed to 1) a topography base map where students can determine which mountain ranges a plant species is associated with, or 2) to a satellite base map to view the actual terrain of the province as seen from a satellite.
- On any base map, students can click on a distribution dot for a species to view the information behind that dot. That is, who made the observation, is it a collection record or an observation (photo) record, when was the species observed, and where did it occur. Eventually, they will be able to click on their own distribution dot if they have submitted photos records.
Assessment:
- What is biogeography? (plant geography/animal geography)
- Why is it important to study biogeography?
- What is the difference between the study of biogeoraphy and ecology?
- Which geographical factors or physical factors influence species distribution?
- That is, what role do factors such as latitude, landcape, climate, rainfall, or elevation play in species distributions?
- How do BC mountains and elevation influence species distributions? Are there 'mountain only' species in BC?
- What is the relationship between biogeography and climate change?
- How will species distributions shift as the temperature warms?
- What is a rare species or 'species-at-risk'? Why are species rare?
- What is a red-listed or blue-listed species?
- What is citizen science or VGI?
- How do we ensure that VGI or citizen science-collected data is valid and useful to scientists now and in the future?
Page prepared by Adriana Briseno-Garzon, 2013
